


canvasXpress was developed as the core visualization component for bioinformatics and systems biology analysis at Bristol-Myers Squibb. It supports a large number of visualizations to display scientific and non-scientific data. canvasXpress also includes a simple and unobtrusive user interface to explore complex data sets, a sophisticated and unique mechanism to keep track of all user customization for Reproducible Research purposes, as well as an ‘out of the box’ broadcasting capability to synchronize selected data points in all canvasXpress plots in a page. Data can be easily sorted, grouped, transposed, transformed or clustered dynamically. The fully customizable mouse events as well as the zooming, panning and drag-and-drop capabilities are features that make this library unique in its class.
canvasXpress can be now simply used within R at the console to generate conventional plots, in R-Studio or seamlessly embedded in Shiny web applications. Full-fledged examples of the canvasXpress library including the mouse events, zooming, and broadcasting capabilities are included in this package in several examples that can be accessed using the cxShinyExample function. This canvasXpress R library was created with the htmlwidgets package.
canvasXpress is available for installation from CRAN or you can install the latest version of canvasXpress from GitHub as follows:
These are included to get you started on basic charting - there are many more examples (including complex and compound visualizations) with R code available in the Examples section of the main website at https://www.canvasxpress.org
y <- read.table("https://www.canvasxpress.org/data/cX-irist-dat.txt", header=TRUE, sep="\t",
                quote="", row.names=1, fill=TRUE, check.names=FALSE, stringsAsFactors=FALSE)
z <- read.table("https://www.canvasxpress.org/data/cX-irist-var.txt", header=TRUE, sep= "\t",
                quote="", row.names=1, fill=TRUE, check.names=FALSE, stringsAsFactors=FALSE)

canvasXpress(data      = y,
             varAnnot  = z,
             graphType ="Scatter3D",
             colorBy   = "Species",
             ellipseBy = "Species",
             xAxis     = list("Sepal.Length"),
             yAxis     = list("Petal.Width"),
             zAxis     = list("Petal.Length"),
             theme     = "CanvasXpress",
             title     = "Iris Data Set",
             axisTickScaleFontFactor  = 0.5,
             axisTitleScaleFontFactor = 0.5)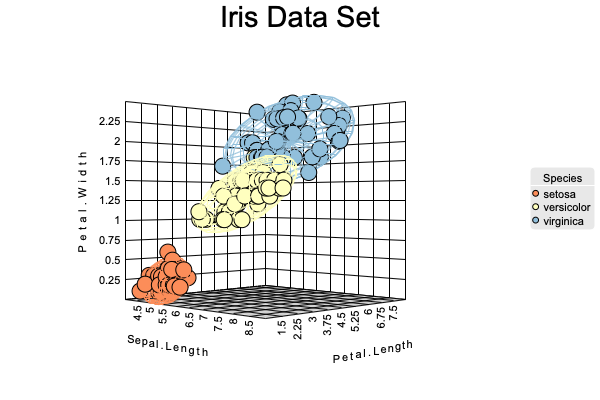
y <- read.table("https://www.canvasxpress.org/data/cX-irist-dat.txt", header=TRUE, sep="\t",
                quote="", row.names=1, fill=TRUE, check.names=FALSE, stringsAsFactors=FALSE)
z <- read.table("https://www.canvasxpress.org/data/cX-irist-var.txt", header=TRUE, sep= "\t",
                quote="", row.names=1, fill=TRUE, check.names=FALSE, stringsAsFactors=FALSE)

canvasXpress(data              = y,
             varAnnot          = z,
             graphType         = "Scatter2D",
             colorBy           = "Species",
             layoutAdjust      = TRUE,
             scatterPlotMatrix = TRUE,
             theme             = "CanvasXpress")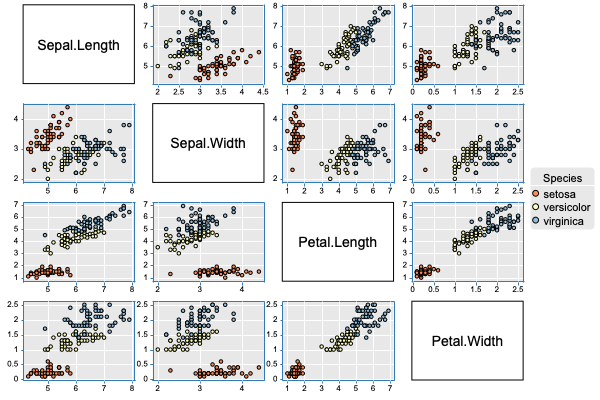
y <- read.table("https://www.canvasxpress.org/data/cX-toothgrowth-dat.txt", header=TRUE, sep="\t",
                quote="", row.names=1, fill=TRUE, check.names=FALSE, stringsAsFactors=FALSE)
x <- read.table("https://www.canvasxpress.org/data/cX-toothgrowth-smp.txt", header=TRUE, sep="\t",
                quote="", row.names=1, fill=TRUE, check.names=FALSE, stringsAsFactors=FALSE)

canvasXpress(data                  = y,
             smpAnnot              = x,
             graphType             = "Boxplot",
             groupingFactors       = list("dose", "supp"),
             stringSampleFactors   = list("dose"),
             graphOrientation      = "vertical",
             colorBy               = "dose",
             title                 = "The Effect of Vitamin C on Tooth Growth in Guinea Pigs",
             smpTitle              = "dose",
             xAxisTitle            = "len",
             smpLabelRotate        = 90,
             xAxisMinorTicks       = FALSE,
             xAxis2Show            = FALSE,
             legendScaleFontFactor = 1.8)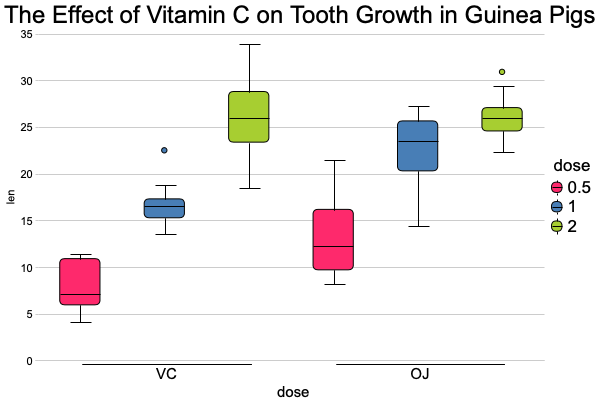
y  <- read.table("https://www.canvasxpress.org/data/cX-multidimensionalheatmap-dat.txt", header=TRUE, sep="\t",
                 quote="", row.names=1, fill=TRUE, check.names=FALSE, stringsAsFactors=FALSE)
y2 <- read.table("https://www.canvasxpress.org/data/cX-multidimensionalheatmap-dat2.txt", header=TRUE, sep="\t",
                 quote="", row.names=1, fill=TRUE, check.names=FALSE, stringsAsFactors=FALSE)
y3 <- read.table("https://www.canvasxpress.org/data/cX-multidimensionalheatmap-dat3.txt", header=TRUE, sep="\t",
                 quote="", row.names=1, fill=TRUE, check.names=FALSE, stringsAsFactors=FALSE)
y4 <- read.table("https://www.canvasxpress.org/data/cX-multidimensionalheatmap-dat4.txt", header=TRUE, sep="\t",
                 quote="", row.names=1, fill=TRUE, check.names=FALSE, stringsAsFactors=FALSE)
x  <- read.table("https://www.canvasxpress.org/data/cX-multidimensionalheatmap-smp.txt", header=TRUE, sep= "\t",
                 quote="", row.names=1, fill=TRUE, check.names=FALSE, stringsAsFactors=FALSE)
z  <- read.table("https://www.canvasxpress.org/data/cX-multidimensionalheatmap-var.txt", header=TRUE, sep= "\t",
                 quote="", row.names=1, fill=TRUE, check.names=FALSE, stringsAsFactors=FALSE)

canvasXpress(data                 = list(y = y, data2 = y2, data3 = y3, data4 = y4),
             smpAnnot             = x,
             varAnnot             = z,
             graphType            = "Heatmap",
             guides               = TRUE,
             outlineBy            = "Outline",
             outlineByData        = "data2",
             shapeBy              = "Shape",
             shapeByData          = "data3",
             sizeBy               = "Size",
             sizeByData           = "data4",
             showHeatmapIndicator = FALSE,
             afterRender          = list(list("clusterSamples")))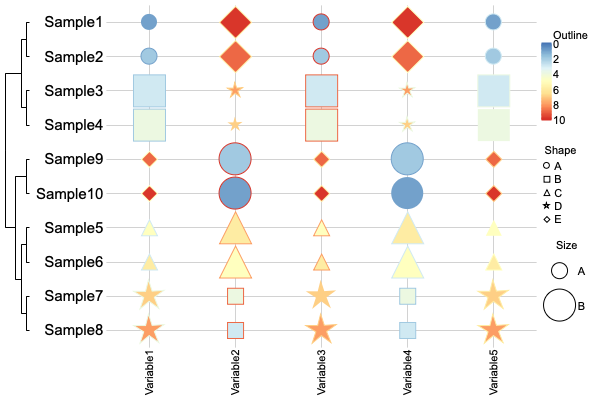
canvasXpress(vennData   = data.frame(AC=456, A=340, ABC=552, ABCD=148, BC=915, ACD=298, BCD=613,
                                     B=562, CD=143, ABD=578, C=620, D=592, AB=639, BD=354, AD=257),
             graphType  = "Venn",
             vennLegend = list(A="List 1", D="List 4", C="List 3", B="List 2"),
             vennGroups = 4)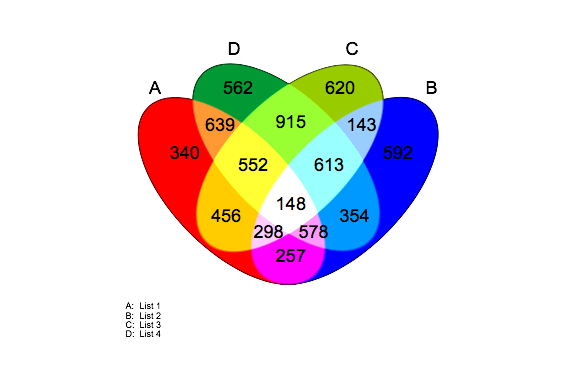
In addition to the built-in package documentation there are vignettes with more information on getting started and additional examples:
#List all package vignettes
vignette(package = "canvasXpress")

#View a specific vignette
vignette("getting_started", package = "canvasXpress")
vignette("additional_examples", package = "canvasXpress")
For the use of canvasXpress plots in shiny there are interactive examples available through the package function cxShinyExample
#List example names
cxShinyExample()

#Run an interactive shiny example
cxShinyExample(example = "example1")
There is also a wealth of additional information including full API documentation and extensive R and JavaScript examples at https://www.canvasxpress.org.