![]()
{timevis} lets you create rich and fully interactive timeline visualizations in R. Timelines can be included in Shiny apps or R markdown documents. {timevis} includes an extensive API to manipulate a timeline after creation, and supports getting data out of the visualization into R. This package is based on the visjs Timeline JavaScript library.
Need Shiny help? I’m
available for consulting.
If you find
{timevis} useful, please consider supporting my work to
unlock rewards! ❤
![]()
This package is part of a larger ecosystem of packages with a shared vision: solving common Shiny issues and improving Shiny apps with minimal effort, minimal code changes, and straightforward documentation. Other packages for your Shiny apps:
| Package | Description | Demo |
|---|---|---|
| shinyjs | 💡 Easily improve the user experience of your Shiny apps in seconds | 🔗 |
| shinyalert | 🗯️ Easily create pretty popup messages (modals) in Shiny | 🔗 |
| shinyscreenshot | 📷 Capture screenshots of entire pages or parts of pages in Shiny apps | 🔗 |
| shinycssloaders | ⌛ Add loading animations to a Shiny output while it’s recalculating | 🔗 |
| colourpicker | 🎨 A colour picker tool for Shiny and for selecting colours in plots | 🔗 |
| shinybrowser | 🌐 Find out information about a user’s web browser in Shiny apps | 🔗 |
| shinydisconnect | 🔌 Show a nice message when a Shiny app disconnects or errors | 🔗 |
| shinyforms | 📝 Easily create questionnaire-type forms with Shiny | WIP |
Click here to view an interactive demo of many {timevis} features.
If you create a cool timeline with {timevis}, I’d love to hear about it!
Sponsors 🏆
There are no sponsors yet
Become the first sponsor for {timevis}!
Installation
For most users: To install the stable CRAN version:
install.packages("timevis")For advanced users: To install the latest development version from GitHub:
install.packages("remotes")
remotes::install_github("daattali/timevis")
How to use
You can view a minimal timeline without any data by simply running
library(timevis)
timevis()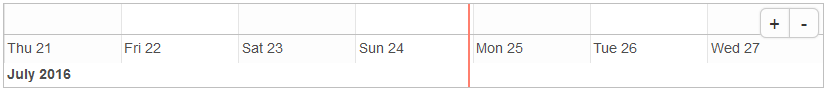
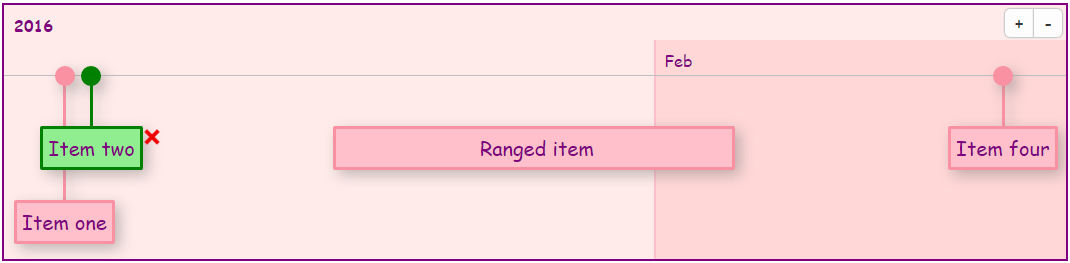
You can add data to the timeline by supplying a data.frame
data <- data.frame(
  id      = 1:4,
  content = c("Item one"  , "Item two"  ,"Ranged item", "Item four"),
  start   = c("2016-01-10", "2016-01-11", "2016-01-20", "2016-02-14 15:00:00"),
  end     = c(NA          ,           NA, "2016-02-04", NA)
)

timevis(data)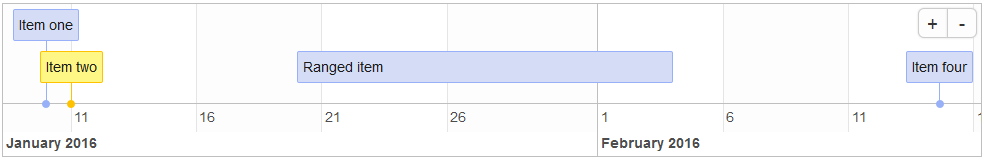
Every item must have a content and a start
variable. If the item is a time range rather than a single point in
time, you can supply an end as well. id is
only required if you want to access or manipulate an item.
There are more variables that can be used in the data.frame – they
are all documented in the help file for ?timevis() under
the Data format section.
By default, a timeline will show the current date as a red vertical
line and will have zoom in/out buttons. You can supply many
customization options to timevis() in order to get it just
right (see ?timevis() for details).
Slightly more advanced examples
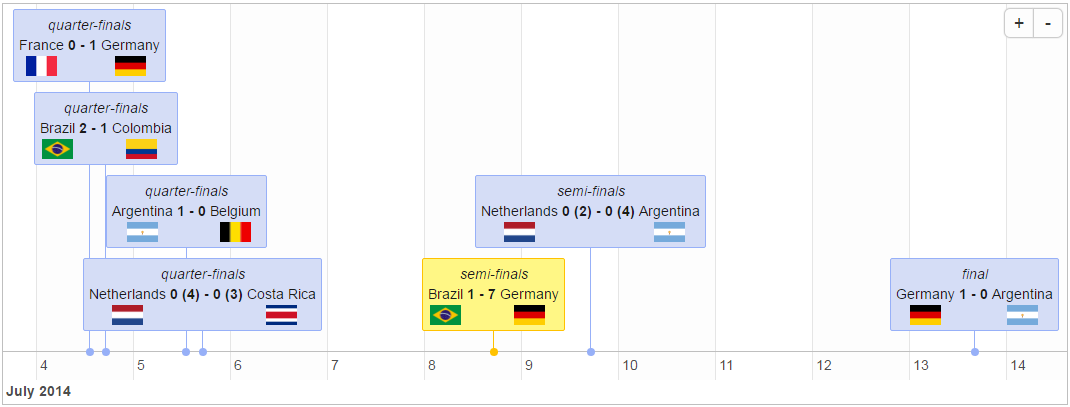
The content of an item can even include HTML, which makes it easy to show any kind of data in a timeline, such as the matches of the 2014 World Cup:
If you know some CSS, you can completely customize the look of the timeline:
Interactivity
The timeline lets the user interact with it seamlessly. You can click on the zoom in/out buttons or drag the timeline left/right in order to move to past/future dates.
If you set the editable = TRUE option, then the user
will be able to add new items by double clicking, modify items by
dragging, and delete items by selecting them.
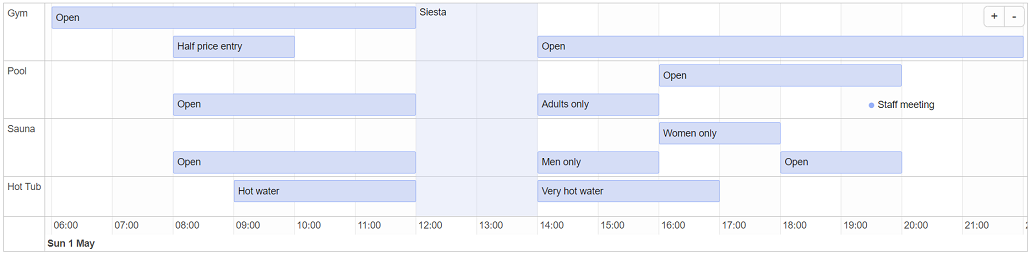
Groups
You can use the groups feature to group together multiple items into “buckets”. When using groups, all items with the same group are placed on one line. A vertical axis is displayed showing the group names. Grouping items can be useful for a wide range of applications, for example when showing availability of multiple people, rooms, or other resources next to each other. You can also think of groups as “adding a Y axis”.
Here is an example of a timeline that has four groups: “Gym”, “Pool”, “Sauna”, “Hot Tub”:
In order to use groups, items in the data need to have group ids, and
a separate dataframe containing the group information needs to be
provided. More information about using groups is available in the help
file for ?timevis() under the Groups
section.
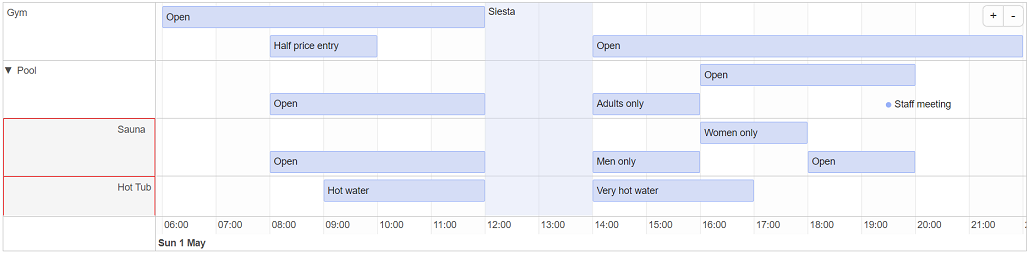
Groups can also contain nested groups. The next example is similar to the previous one, except “Sauna” and “Hot Tub” are now nested under “Pool”:
Refer to the visjs Timeline documentation to see all the options that are supported.
Functions to manipulate a timeline
There are many functions that allow programmatic manipulation of a
timeline. For example: addItem() programmatically adds a
new item, centerItem() moves the timeline so that a given
item is centered, setWindow() sets the start and end dates
of the timeline, setOptions() updates the configuration
options, and many more functions are available.
There are two ways to call these timeline manipulation functions:
%>% on timevis()You can manipulate a timeline widget during its creation by chaining
functions to the timevis() call. For example:
timevis() %>%
  addItem(list(id = "item1", content = "one", start = "2016-08-01")) %>%
  centerItem("item1")
This method of manipulating a timeline is especially useful when creating timeline widgets in the R console or in R markdown documents because it can be used directly when initializing the widget.
In Shiny apps, you can manipulate a timeline widget at any point after its creation by referring to its ID. For example:
library(shiny)

ui <- fluidPage(
  timevisOutput("mytime"),
  actionButton("btn", "Add item and center")
)

server <- function(input, output, session) {
  output$mytime <- renderTimevis(timevis())
  observeEvent(input$btn, {
    addItem("mytime", list(id = "item1", content = "one", start = "2016-08-01"))
    centerItem("mytime", "item1")
  })
}

shinyApp(ui = ui, server = server)
You can even chain these functions and use this manipulation code instead of the bold code:
addItem("mytime", list(id = "item1", content = "one", start = "2016-08-01")) %>%
  centerItem("item1")
Technical note: If you’re trying to understand how both methods
of timeline manipulation work, it might seem very bizarre to you. The
reason they work is that every manipulation function accepts either a
timevis object or the ID of one. In order to make chaining
work, the return value from these functions depend on the input: if a
timevis object was given, then an updated
timevis object is returned, and if an ID was given, then
the same ID is returned.
If you need to perform any actions on the timeline object that are
not supported by the {timevis} API, you may be able to do so by
manipulating the timeline’s JavaScript object directly. The timeline
object is available via
document.getElementById("id").widget.timeline (replace
id with the timeline’s id).
This timeline object is the direct widget that vis.js creates, and you can see the visjs documentation to see what actions you can perform on that object.
In a Shiny app
You can add a timeline to a Shiny app by adding
timevisOutput() to the UI and
renderTimevis(timevis()) to the server.
Retrieving data from the widget
It is possible to retrieve data from a timeline in a Shiny app. When
a timeline widget is created in a Shiny app, there are four pieces of
information that are always accessible as Shiny inputs. These inputs
have special names based on the timeline’s id. Suppose that a timeline
is created with an outputId of “mytime”,
then the following four input variables will be available:
You can view examples of many of the features supported by checking out the demo Shiny app. If you want to see how those examples were created, the full code for the examples is inside inst/example.
Lastly, if you want to learn how to develop an htmlwidget to have
similar features as this package, you can check out the timevisBasic
package or my
tutorial on htmlwidgets tips.
Logo design by Alfredo Hernández.