![]()
The goal of figpatch is to create an easy way to incorporate external figures and images into figures assembled with {patchwork}.
You can install the released version of figpatch from CRAN with:
install.packages("figpatch")Install the development version from GitHub with:
# install.packages("devtools")
devtools::install_github("BradyAJohnston/figpatch")library(figpatch)
library(ggplot2)
library(patchwork)To use images inside of a patchwork object, they need to be converted
to a {ggplot} object via fig(). Once
converted, you can assemble the {patchwork} as you would
otherwise with + / - * & or
wrap_plots().
image_path <- system.file(
  "extdata",
  "fig.png",
  package = "figpatch",
  mustWork = TRUE)

img <- fig(image_path)

plt <- ggplot(mtcars) +
  aes(mpg, cyl) +
  geom_point()

wrap_plots(img, plt, plt, img)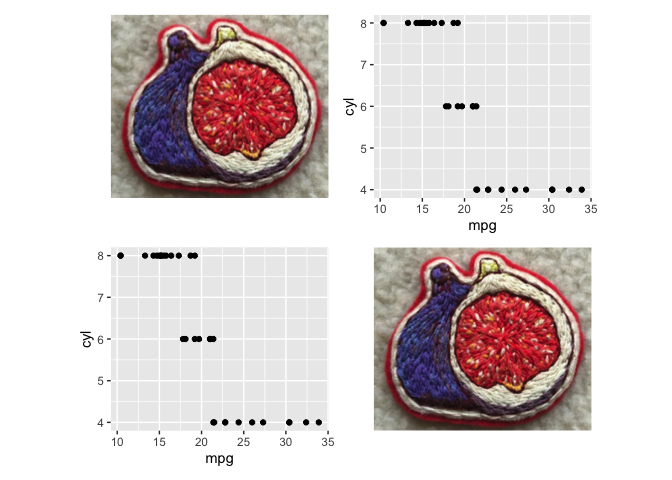
The aspect.ratio of the figs is set to the dimensions of
the image, but the plots can still resize as you would expect. For each
plot that aligns with a fig, it’s dimensions will match that of the fig
(as above). If however it only aligns on one axis, then the other is
free to resize to fill up the total image space (as below).
wrap_plots(plt, img, plt, img, ncol = 2)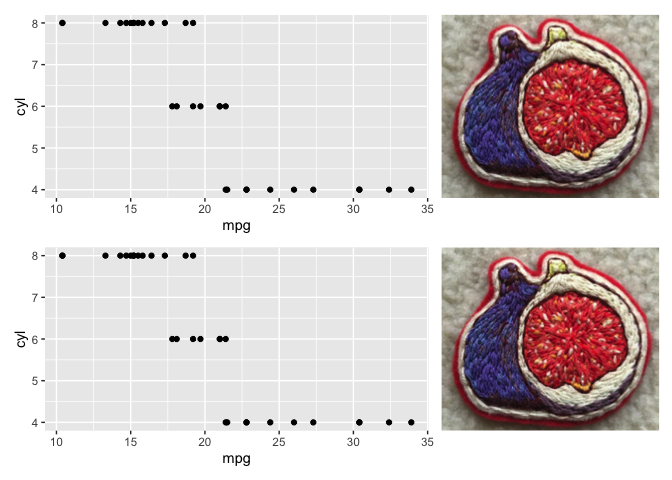
If for some reason you want your fig to also resize (and thus distort
your image) then you can specify a particular aspect.ratio
or let it be free!
free_fig <- fig(image_path, aspect.ratio = "free")

wrap_plots(free_fig, plt, ncol = 1)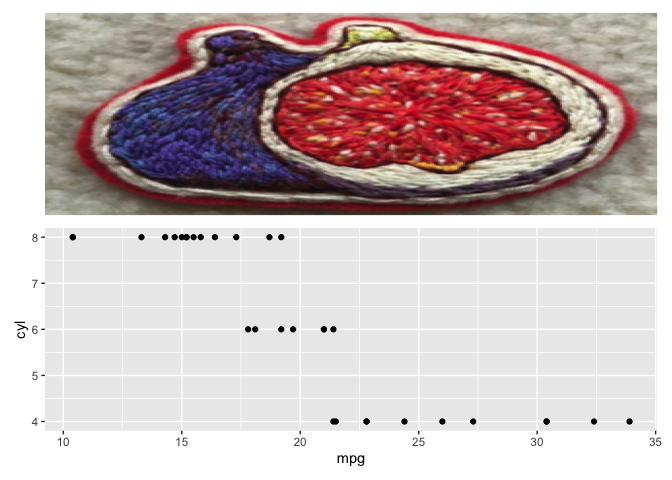
Elegant.
Patchwork already provides support for easy tagging of sub-plots and
sub-figures using plot_annotation().
wrap_plots(img, plt, plt, img) +
  plot_annotation(tag_levels = "A")
For a lot of figures that include images, tags should be placed on
top of the images themselves. Tagging in {patchwork} currently utilises
the ggplot tag option from
ggplot2::labs(tag = ...) but which currently doesn’t support
tagging inside plot borders.
Lets see how it plays out.
knitr::opts_chunk$set(fig.height = 2, fig.width = 7)patchwork::wrap_plots(img, img, img, nrow = 1)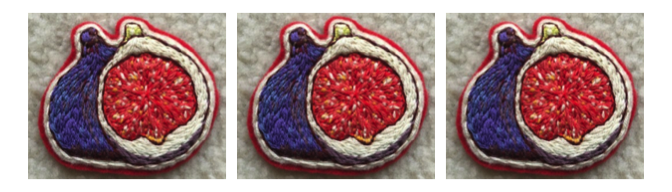
If multiple figs have differing dimensions, but but should be scaled
the same, you can use fig_scale() to scale them all to the
maximum width and height of all of the included figs.
fl <- image_path <- system.file("extdata",
                                package = "figpatch",
                                mustWork = TRUE) %>%
  list.files(pattern = "png",
             full.names = TRUE)

fl %>%
  lapply(fig) %>%
  fig_wrap(ncol = 3)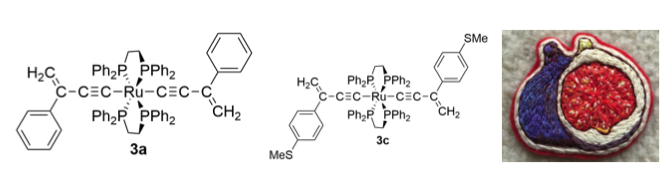
fl %>%
  lapply(fig) %>%
  fig_scale() %>%
  fig_wrap(ncol = 3)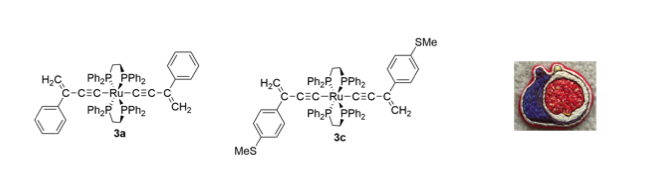
The scaling is based on the number of pixels, so while the two chemical structures are now properly scaled, the fig has been reduced significantly.
We can scale them independently to keep the third fig bigger.
scaled_strctures <- lapply(fl[1:2], fig) %>%
  fig_scale()

fig_wrap(c(scaled_strctures, list(fig(fl[3]))))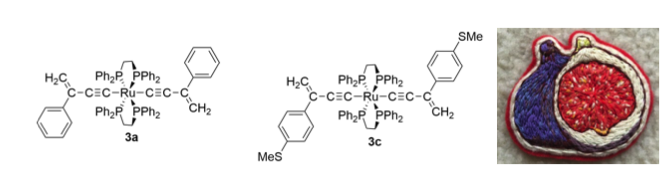
patchwork::wrap_plots(img, img, img, nrow = 1) +
  plot_annotation(tag_levels = "A")
To add internal tags to the figs, use the fig_tag()
function. Assembling with {patchwork} can continue as normal.
img1 <- fig_tag(img, "A")
img2 <- fig_tag(img, "(B)")
img3 <- fig_tag(img, "misc")

patchwork::wrap_plots(img1, img2, img3, nrow = 1)
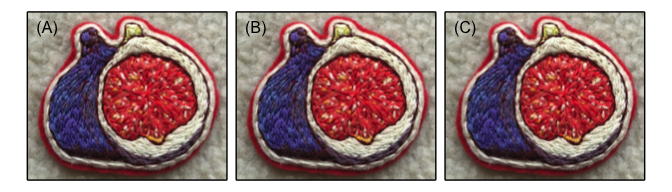
A number of default positions can be supplied to
fig_tag(pos = ...) or a custom vector which will place the
text in npc coordinates (0 to 1 for both x and
y) and automatically adjust for the aspect ratio of the
fig.
img1 <- fig_tag(img, "A", pos = "topright")
img2 <- fig_tag(img, "(B)", pos = "bottomleft")
img3 <- fig_tag(img, "misc", pos = c(0.4, 0.9))

wrap_plots(img1, img2, img3, nrow = 1)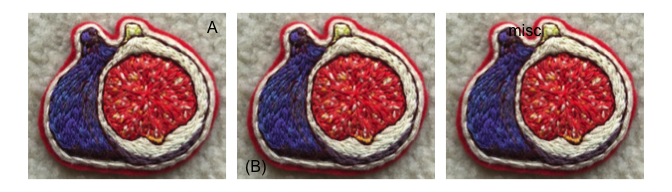
fig_wrap()To quickly label and wrap multiple figures, use
fig_wrap()
To add borders around individual figures, use b_*
options inside of fig_wrap() or specify them individually
with fig().
fig_wrap(
  list(img, img, img),
  "A",
  prefix = "(",
  suffix = ")",
  b_col = "black"
)
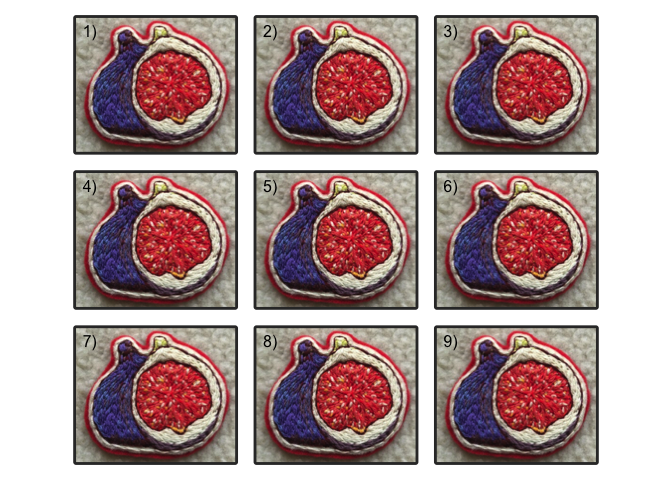
Assembling lots of figures.
knitr::opts_chunk$set(fig.height = 5, fig.width = 7)figs <- lapply(1:9, function(x) img)
fig_wrap(
figs,
nrow = 3,
tag = 1,
suffix = ")",
b_col = "gray20",
b_size = 2
)
Adjust the padding around plots with b_margins and
change the unit used with b_unit.
fig_wrap(
  figs,
  nrow = 3,
  tag = 1,
  suffix = ")",
  b_col = "gray20",
  b_size = 2,
  b_margin = ggplot2::margin(8, 8, 8, 8)
)
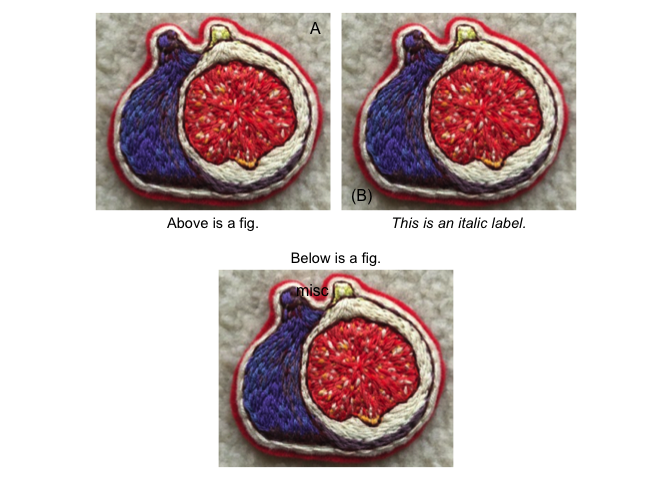
You can add labels to the text using the fig_lab()
function. Some customisations are available. At the end of the day, a
fig() is just a ggplot object, and the labels
are just the axis titles (x or y). You can add your own
theme() elements to customise further.
img1 <- fig_lab(img1, "Above is a fig.")

img2 <- fig_lab(img2, "This is an italic label.", fontface = "italic")

img3 <- fig_lab(img3, "Below is a fig.", pos = "top")

design <- "AB
           CC"

wrap_plots(img1, img2, img3, design = design)