
A simple R package to plot marginal effects from interactions estimated from linear models.
The package contains one simply function: plot_me for
plotting marginal effects from interactions estimated from models
estimated with the lm function in base R. For example, when
the second term is continuous:
# Load package
library(plotMElm)

# Estimate model
states <- as.data.frame(state.x77)
m1 <- lm(Murder ~ Income * Population, data = states)

# Plot marginal effect of Income across the observed range of Population
plot_me(m1, 'Income', 'Population')
## Categorical (Factor) Term 2
When the second term in the interaction is a categorical (factor) variable then point-ranges are plotted. Note that the marginal effect is in terms of the reference category:
# Set Term 2 as a factor variable
mtcars$cyl <- factor(mtcars$cyl,
                     labels = c('4 Cyl', '6 Cyl', '8 Cyl'))

# Estimate model
m2 <- lm(mpg ~ wt * cyl, data = mtcars)

# Plot marginal effect of Weight across the Number of Cylinders
plot_me(m2, 'wt', 'cyl')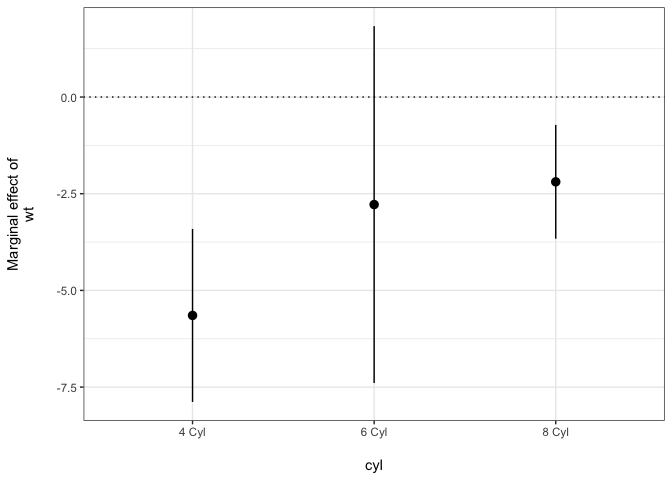
Note that point ranges will also be used if there are five or fewer fitted values.
Esarey
and Sumner show that pointwise confidence intervals from marginal
effect plots produce statistically significant findings at a rate that
can be larger or smaller than is warrented. plot_me allows
users to specify ci_type = 'fdr' to find confidence
intervals that correct for overly confident marginal effects in the face
of multiple comparisons. FDR stands for “False Discovery Rate”. For
example:
# Plot marginal effect of Income across the observed range of Population
# with false discovery rate limited confidence intervals
plot_me(m1, 'Income', 'Population', ci_type = 'fdr')
Here is the result compared with standard confidence intervals:
## t-statistic used: 2.269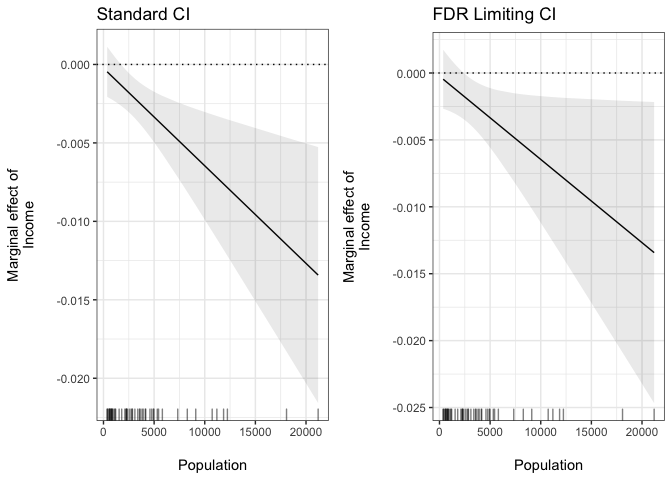
You can also use the t_statistic argument to supply
custom t-statistics for creating the marginal effect confidence
intervals. This is useful if you want to use a funciton like
findMultiLims from the interactTest
package to find t-statistics that can be used to correct confidence
intervals for underconfidence.
The interplot package also has some of the same capabilities as plotMElm.