![]()
![]()


![]()

An easy way to examine archaeological count data. This package provides several tests and measures of diversity: heterogeneity and evenness (Brillouin, Shannon, Simpson, etc.), richness and rarefaction (Chao1, Chao2, ACE, ICE, etc.), turnover and similarity (Brainerd-Robinson, etc.). It allows to easily visualize count data and statistical thresholds: rank vs. abundance plots, heatmaps, Ford (1962) and Bertin (1977) diagrams, etc. tabula provides methods for:
heterogeneity(), evenness(), richness(), rarefaction(), turnover().similarity(), occurrence().bootstrap(), jackknife(), simulate().plot_bertin(), plot_ford().seriograph(), matrigraph().plot_heatmap(), plot_spot().kairos is a companion package to tabula that provides functions for chronological modeling and dating of archaeological assemblages from count data.
To cite tabula in publications use:

  Frerebeau N (2019). "tabula: An R Package for Analysis, Seriation,
  and Visualization of Archaeological Count Data." _Journal of Open
  Source Software_, *4*(44). doi:10.21105/joss.01821
  <https://doi.org/10.21105/joss.01821>.

  Frerebeau N (2023). _tabula: Analysis and Visualization of
  Archaeological Count Data_. Université Bordeaux Montaigne, Pessac,
  France. doi:10.5281/zenodo.1489944
  <https://doi.org/10.5281/zenodo.1489944>, R package version 3.0.1,
  <https://packages.tesselle.org/tabula/>.

This package is a part of the tesselle project
<https://www.tesselle.org>.You can install the released version of tabula from CRAN with:
And the development version from GitHub with:
It assumes that you keep your data tidy: each variable (type/taxa) must be saved in its own column and each observation (sample/case) must be saved in its own row.
## Data from Lipo et al. 2015
data("mississippi", package = "folio")

## Ford diagram
plot_ford(mississippi)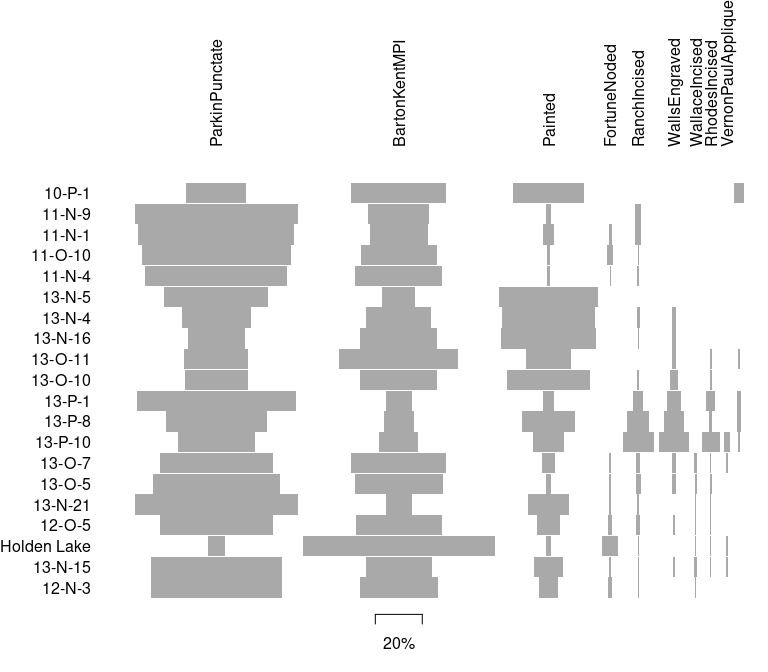
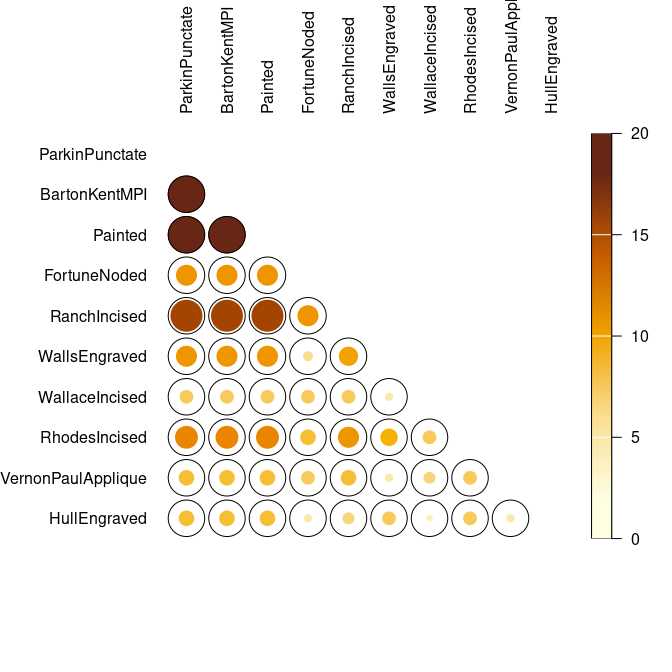
## Data from Conkey 1980, Kintigh 1989, p. 28
data("chevelon", package = "folio")

## Measure diversity by comparing to simulated assemblages
set.seed(12345)

chevelon |>
  heterogeneity(method = "shannon") |>
  simulate() |>
  plot()

chevelon |>
  richness(method = "count") |>
  simulate() |>
  plot()

Please note that the tabula project is released with a Contributor Code of Conduct. By contributing to this project, you agree to abide by its terms.
Bertin, Jacques. 1977. La graphique et le traitement graphique de l’information. Nouvelle bibliothèque scientifique. Paris: Flammarion.
Desachy, Bruno. 2004. “Le sériographe EPPM: un outil informatisé de sériation graphique pour tableaux de comptages.” Revue archéologique de Picardie 3 (1): 39–56. https://doi.org/10.3406/pica.2004.2396.
Ford, J. A. 1962. A Quantitative Method for Deriving Cultural Chronology. Technical Manual 1. Washington, DC: Pan American Union.